 MATEO ZAPATA
Dashboard
PraxyAI’s Dashboard is the control board for the corporate brain: consumption, resources, AI audit, perceived quality, and the map of the operation — in one place, without tickets to IT or improvised spreadsheets.
Overview
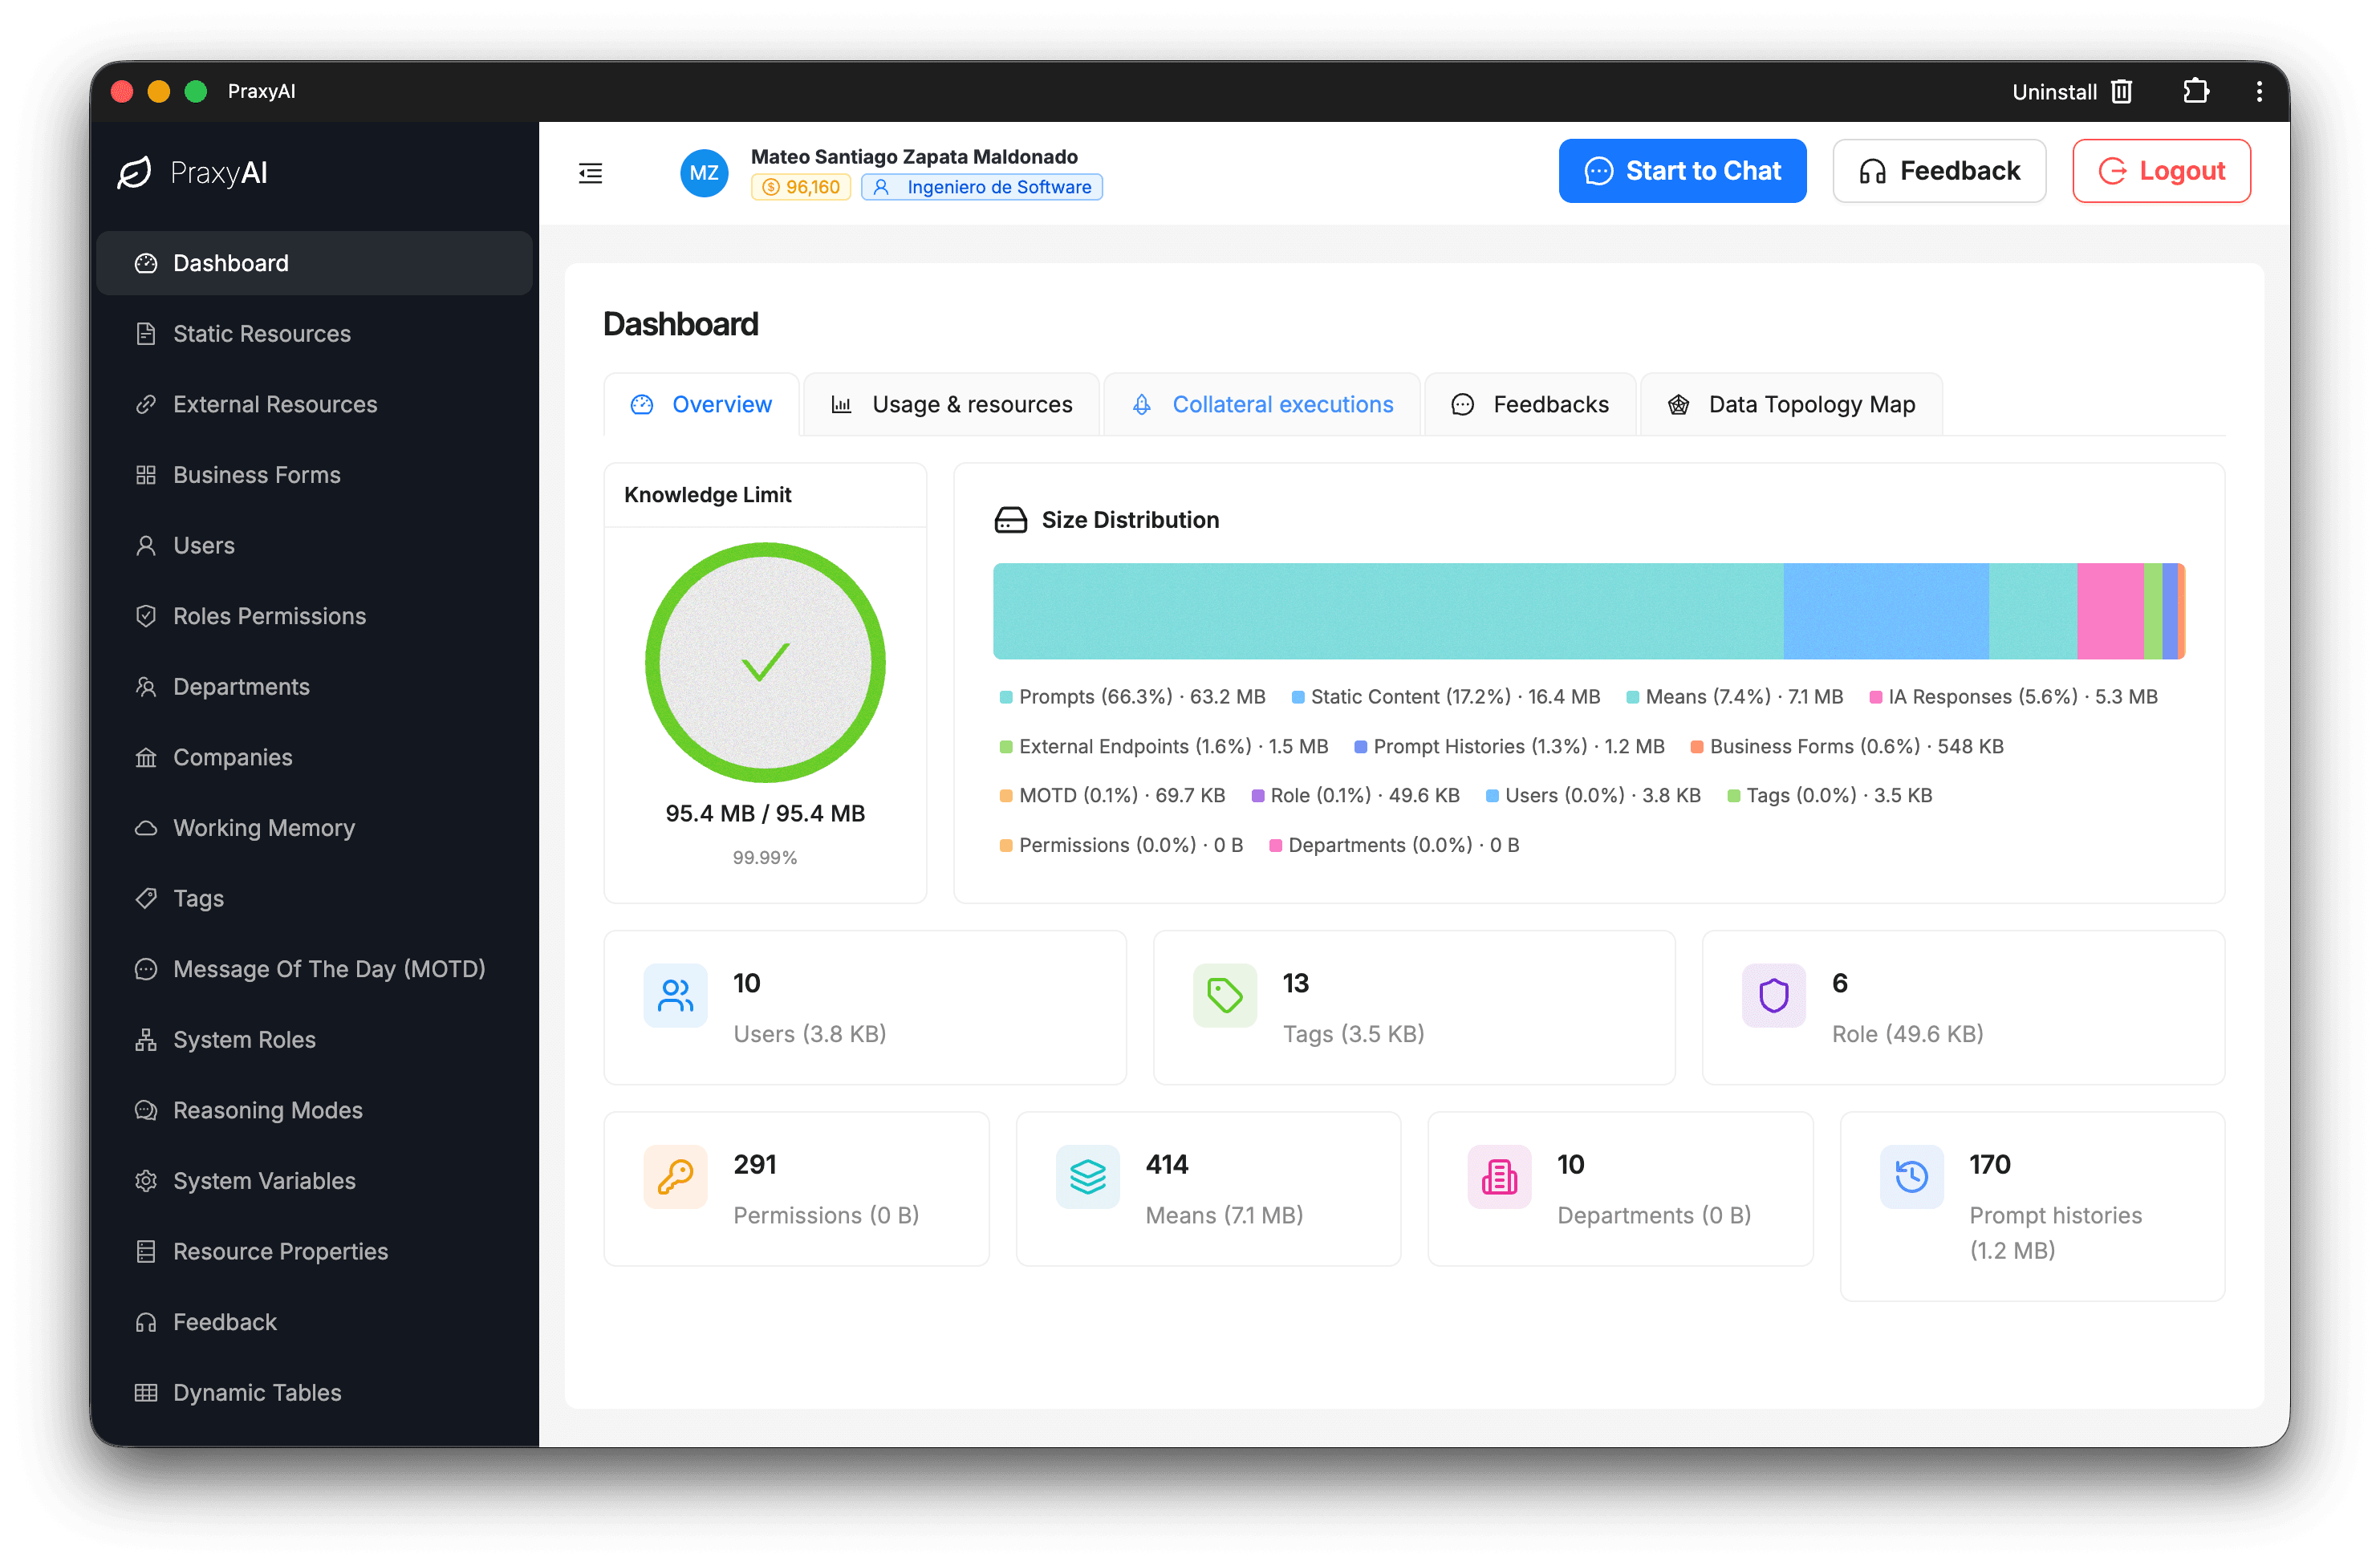
The executive snapshot of the tenant: period tokens vs plan limit, storage vs quota, and the daily trend. You know whether the conversational operation is inside budget before finance or the provider surprises you.
Usage & resources
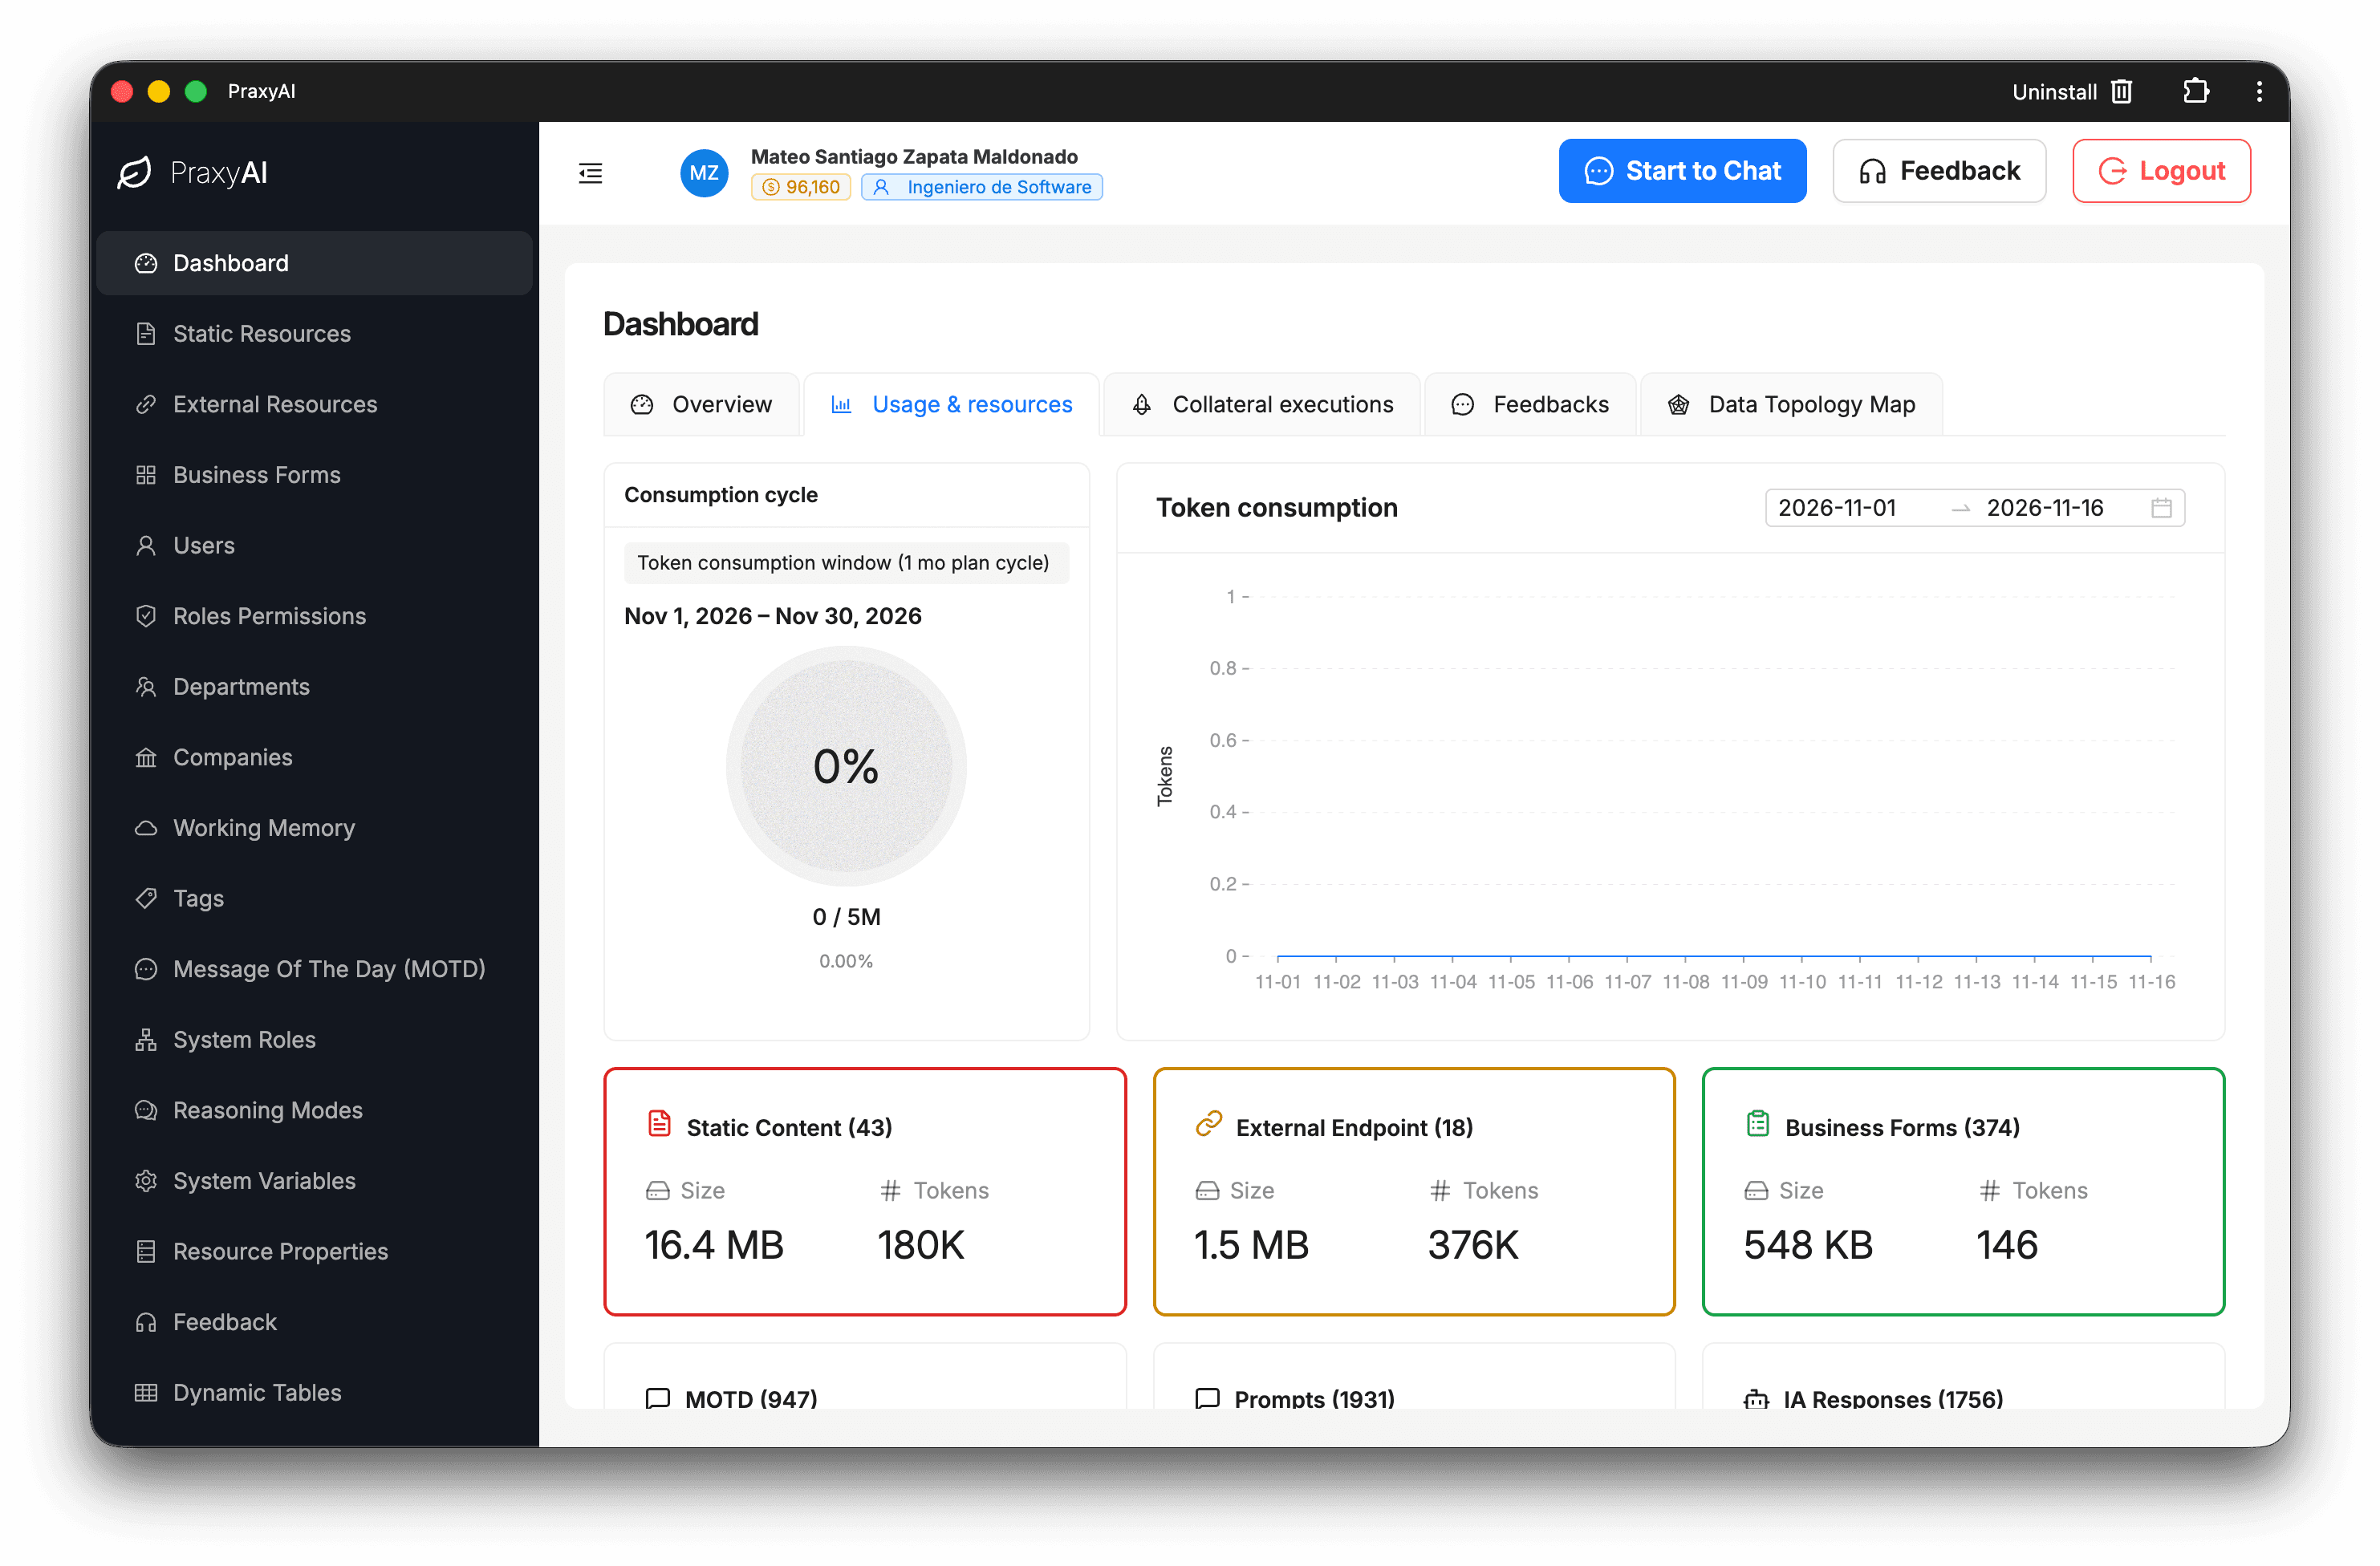
It opens the engine by layer — knowledge, endpoints, prompts, responses, forms — and shows where storage and tokens actually weigh. You stop “having a lot of AI” in the dark and start deciding what to archive, what to reinforce, and how to grow without inflating cost.
Collateral Executions
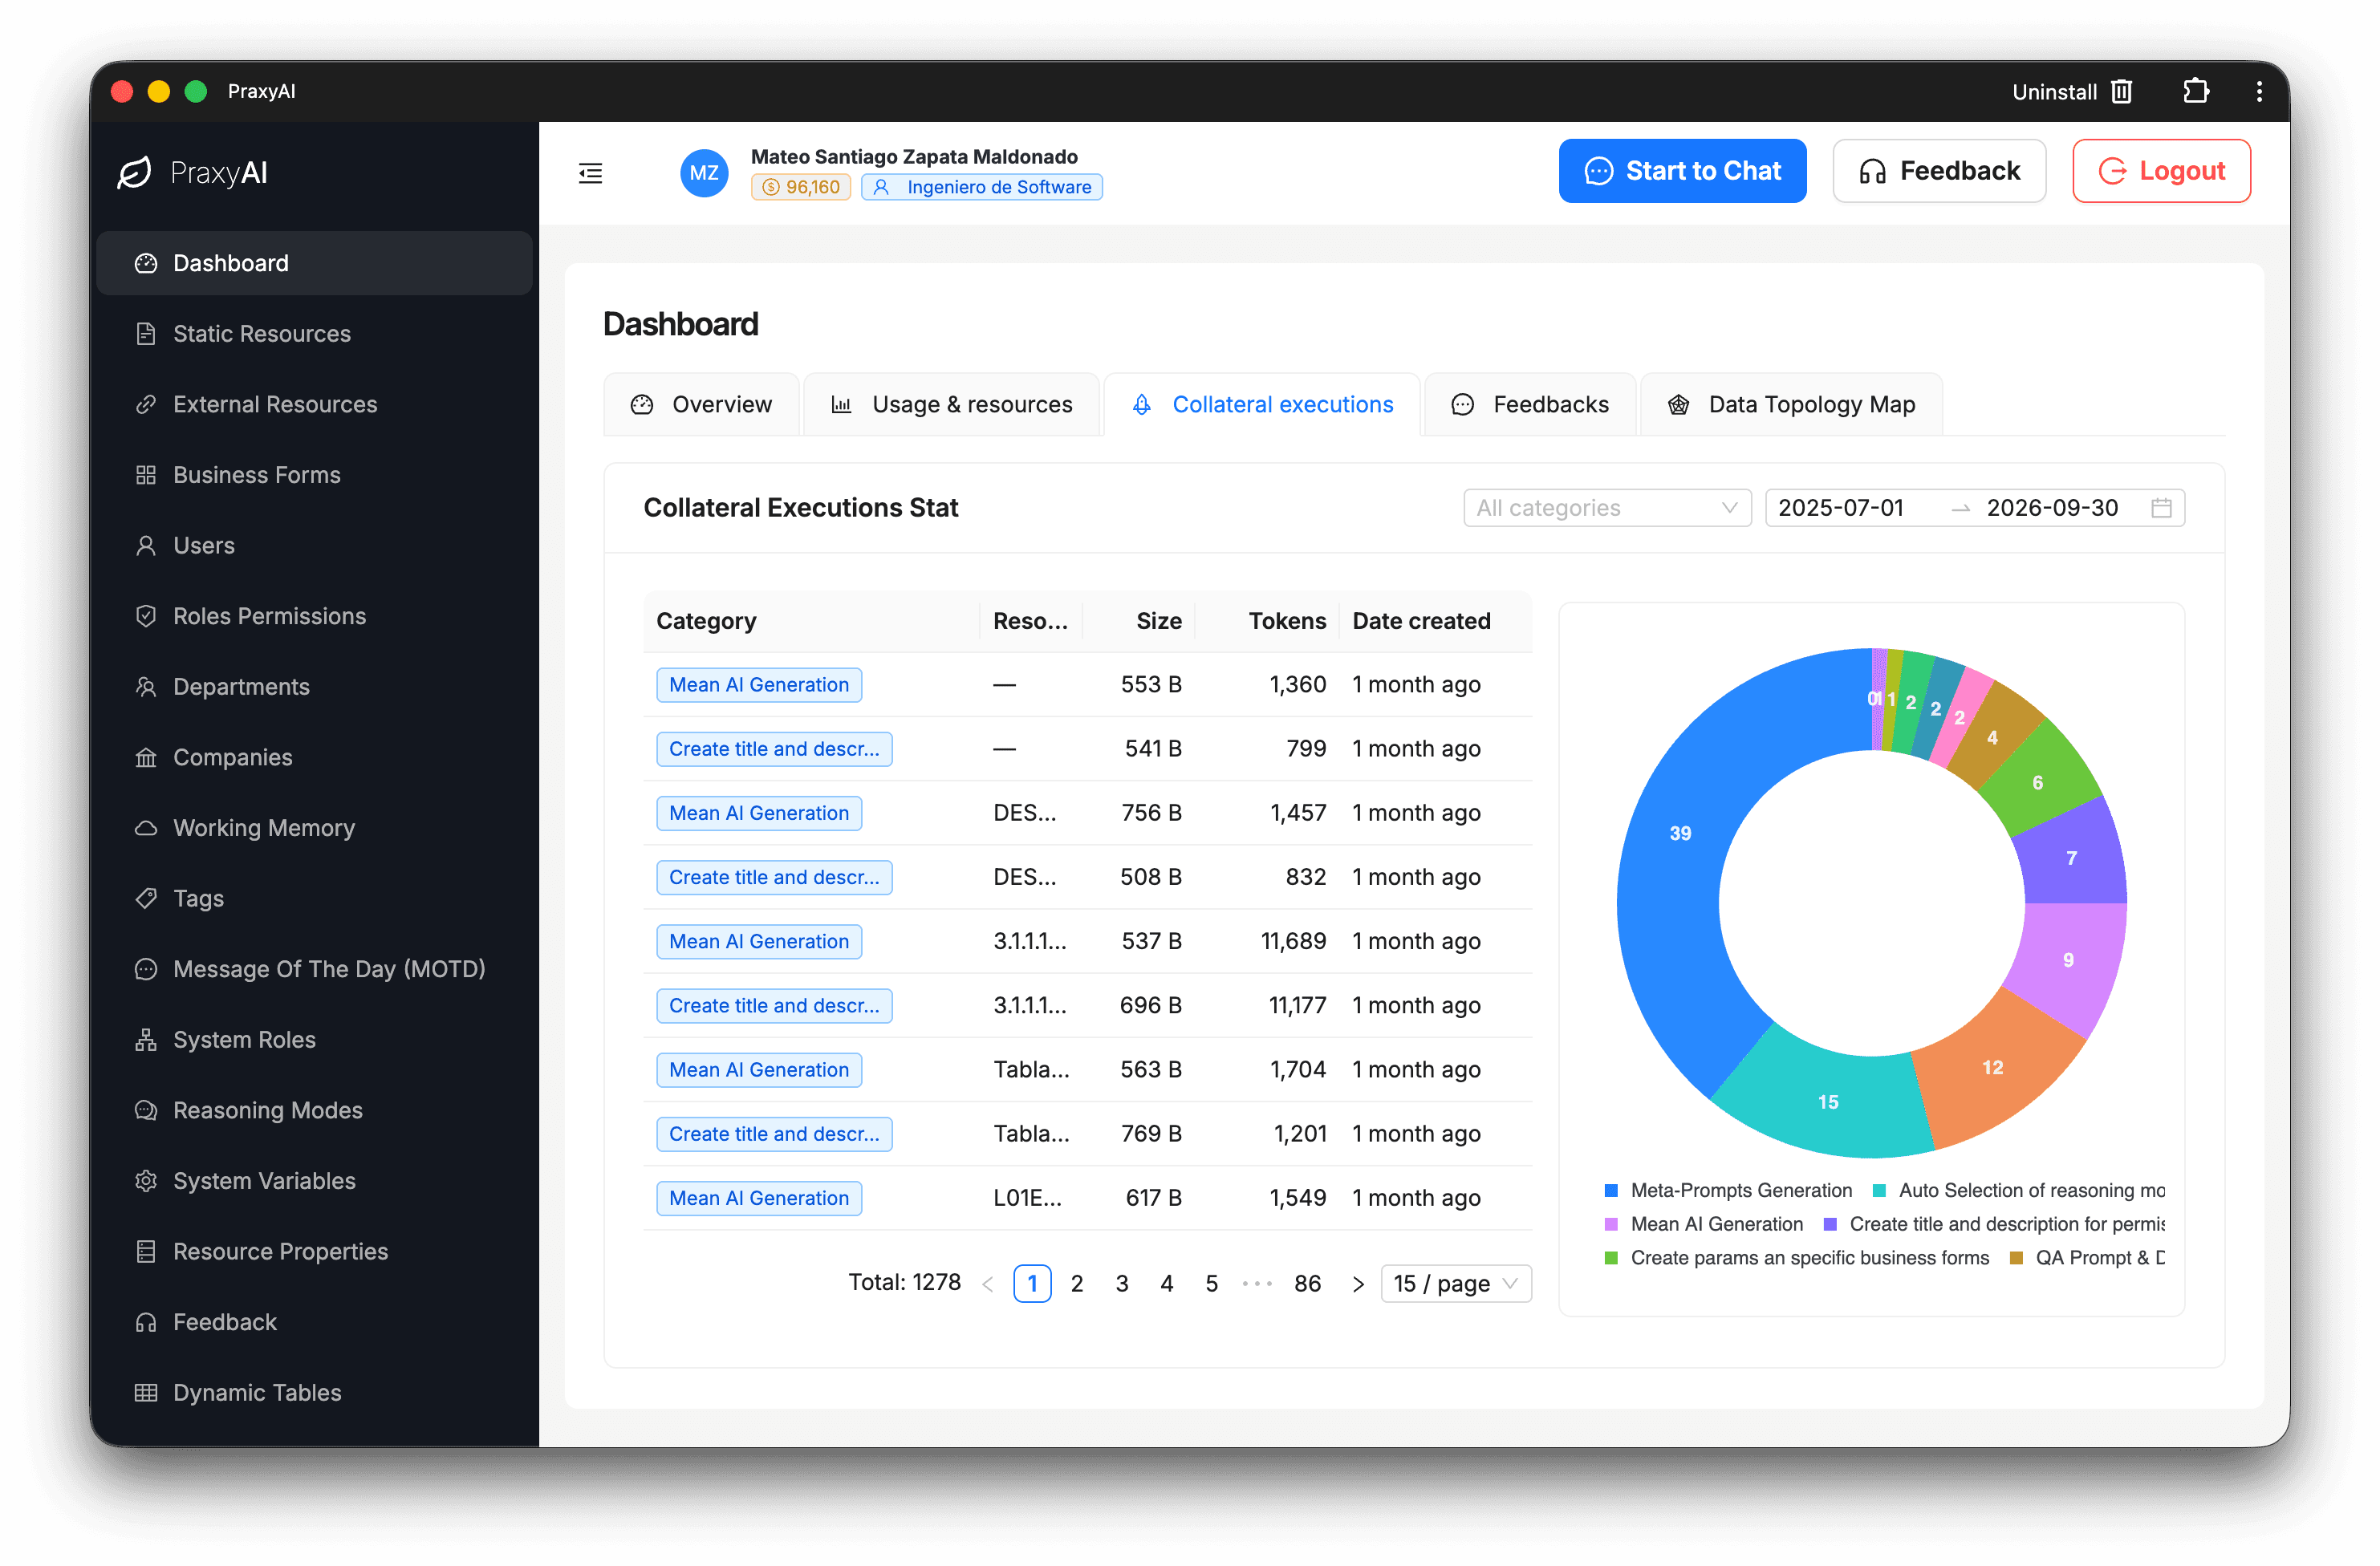
The log of the AI’s invisible work: generating parameters, means, audits, auto-selecting modes, and more, with tokens, resource, and category. Compliance and cost stop being a black box: you can explain what the system did, what for, and at what price.
Feedback
It turns likes, dislikes, and comments into approval and resolution metrics, with operational close-out and a context assistant when needed. The team leaves complaints in Slack and gains a measurable continuous-improvement loop.
Data-topology maps
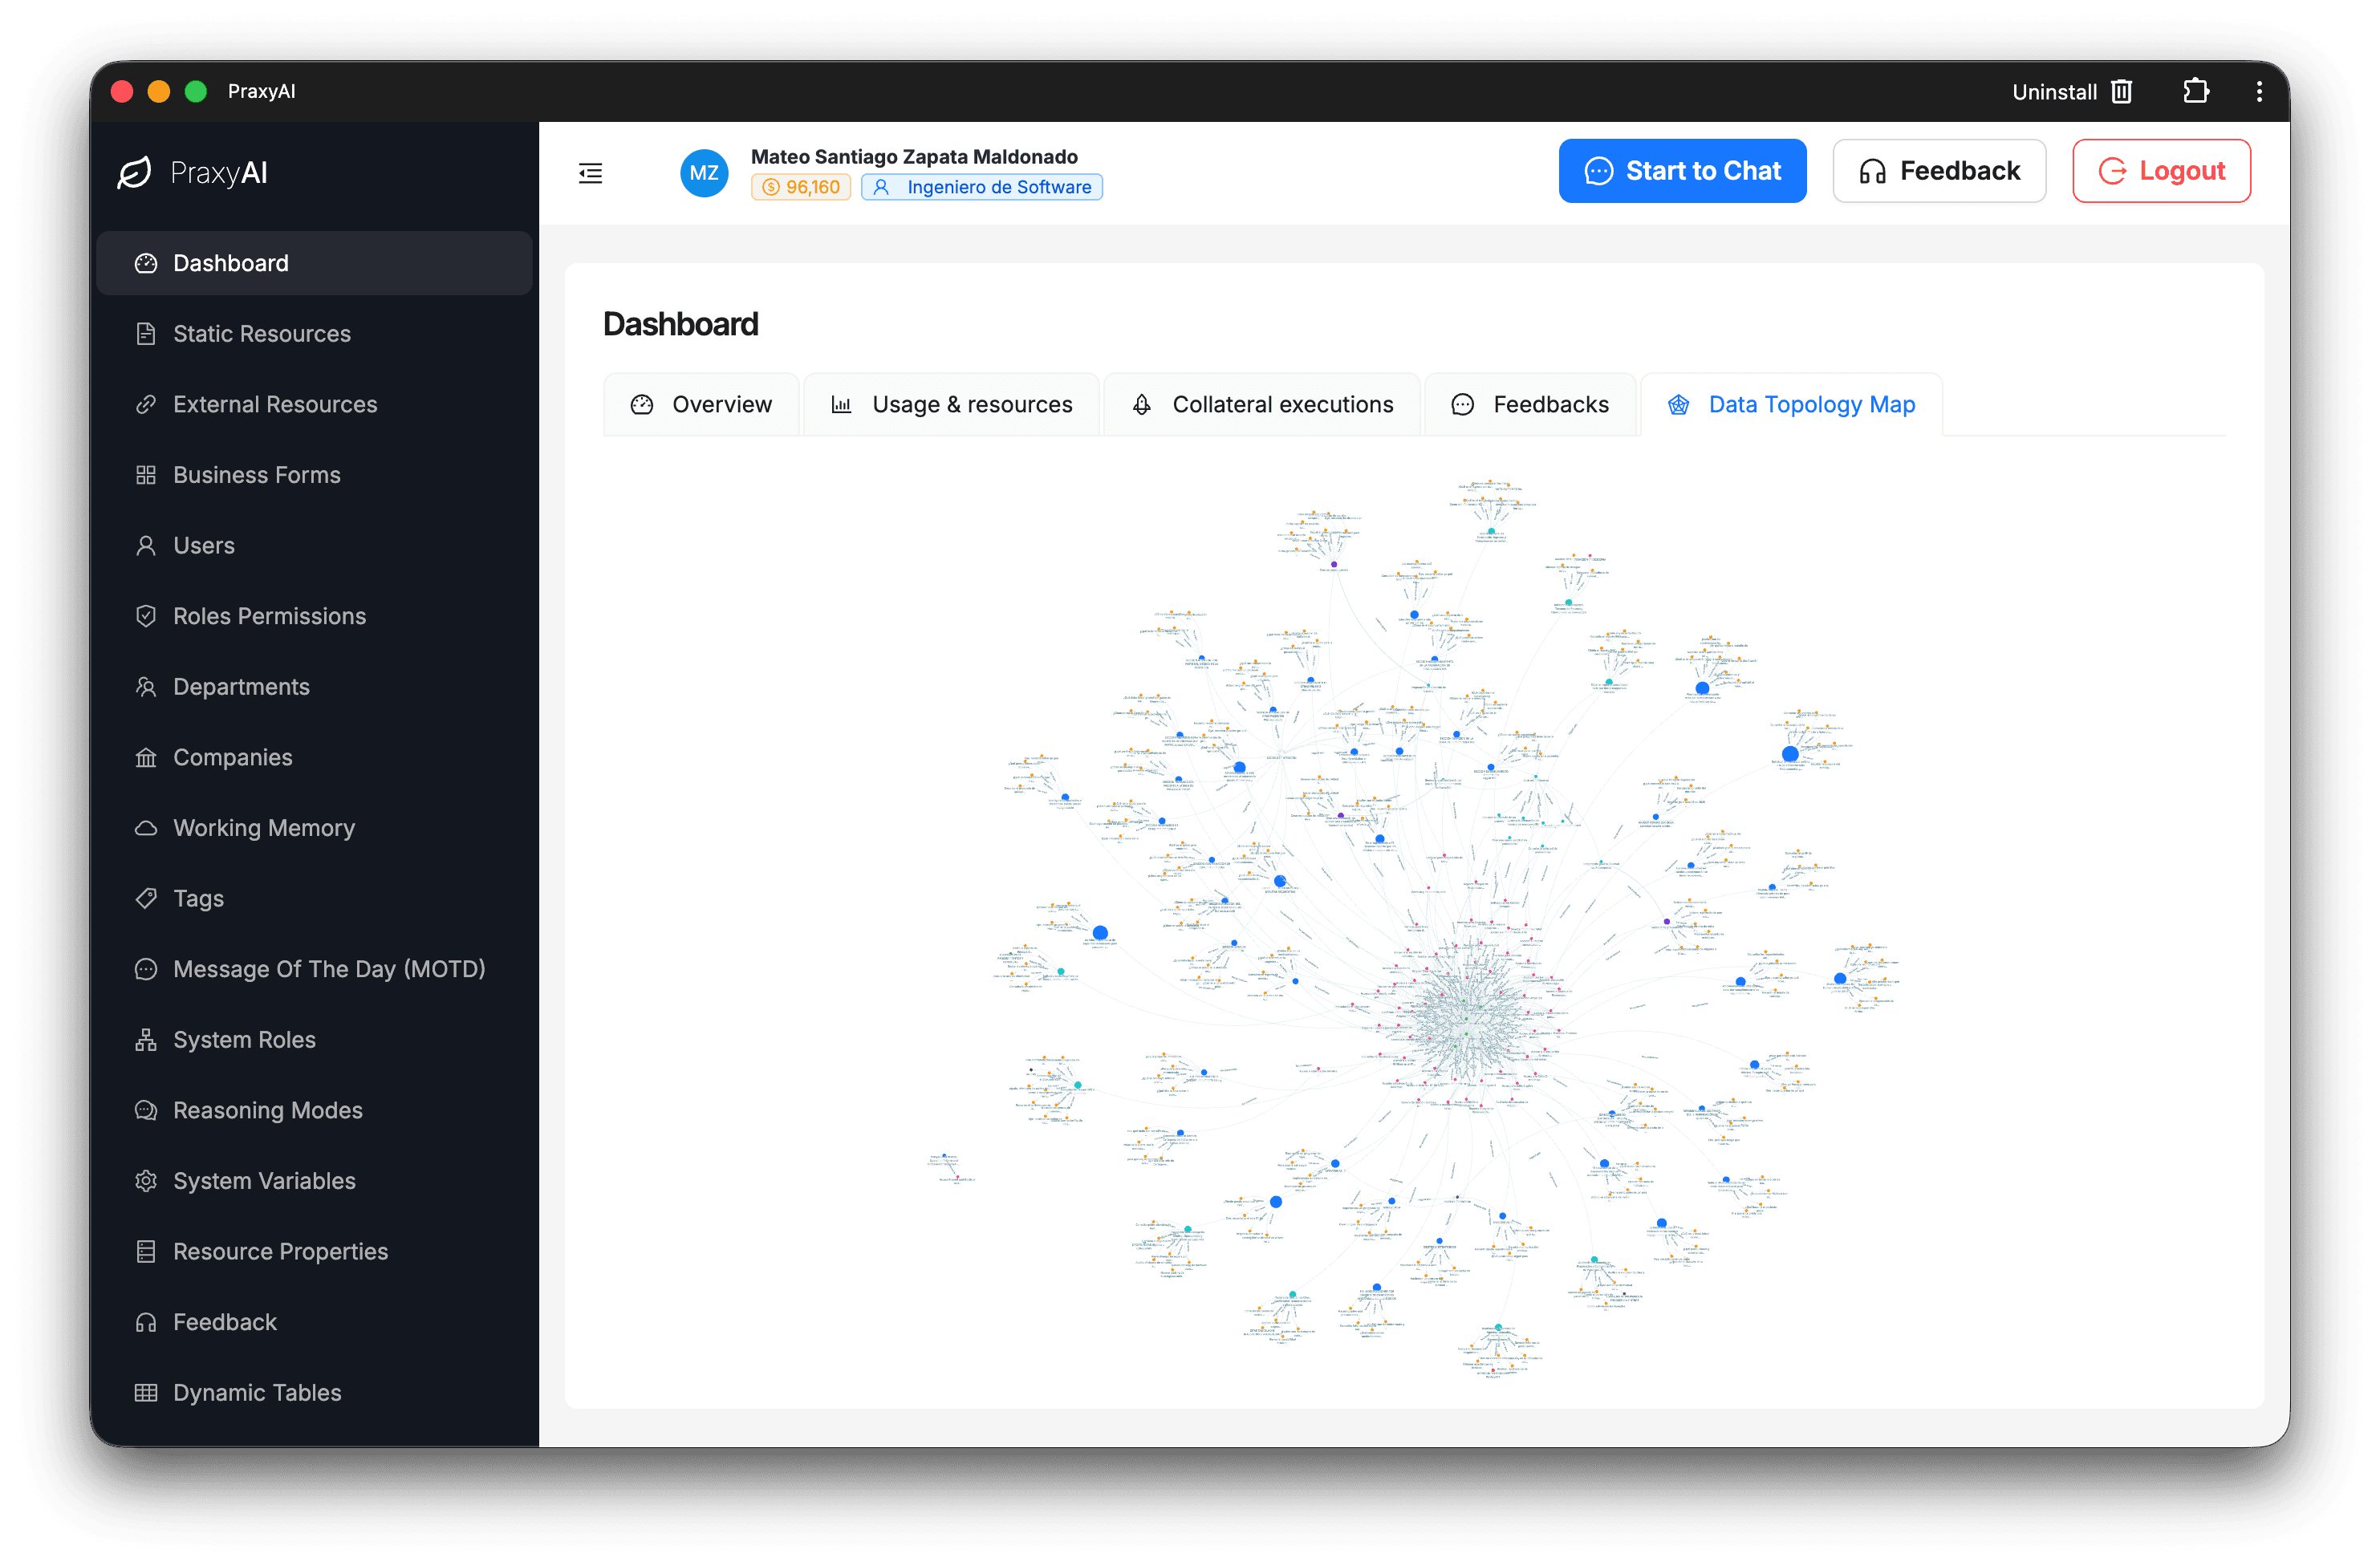
A living graph of the tenant: documents, APIs, and SDUI forms, with aliases (means), tags, permissions, and roles — plus a size footprint per node. In seconds you see how the company is wired and where to govern access, discovery, and weight.