 MATEO ZAPATA
Dashboard
While the dentist generates simulations, quotes, and audio, the system quietly records every AI use and every external API. The Dashboard turns that technical noise into a clear answer: how much is DocBrok costing me? where does it go? is my patient pipeline growing?
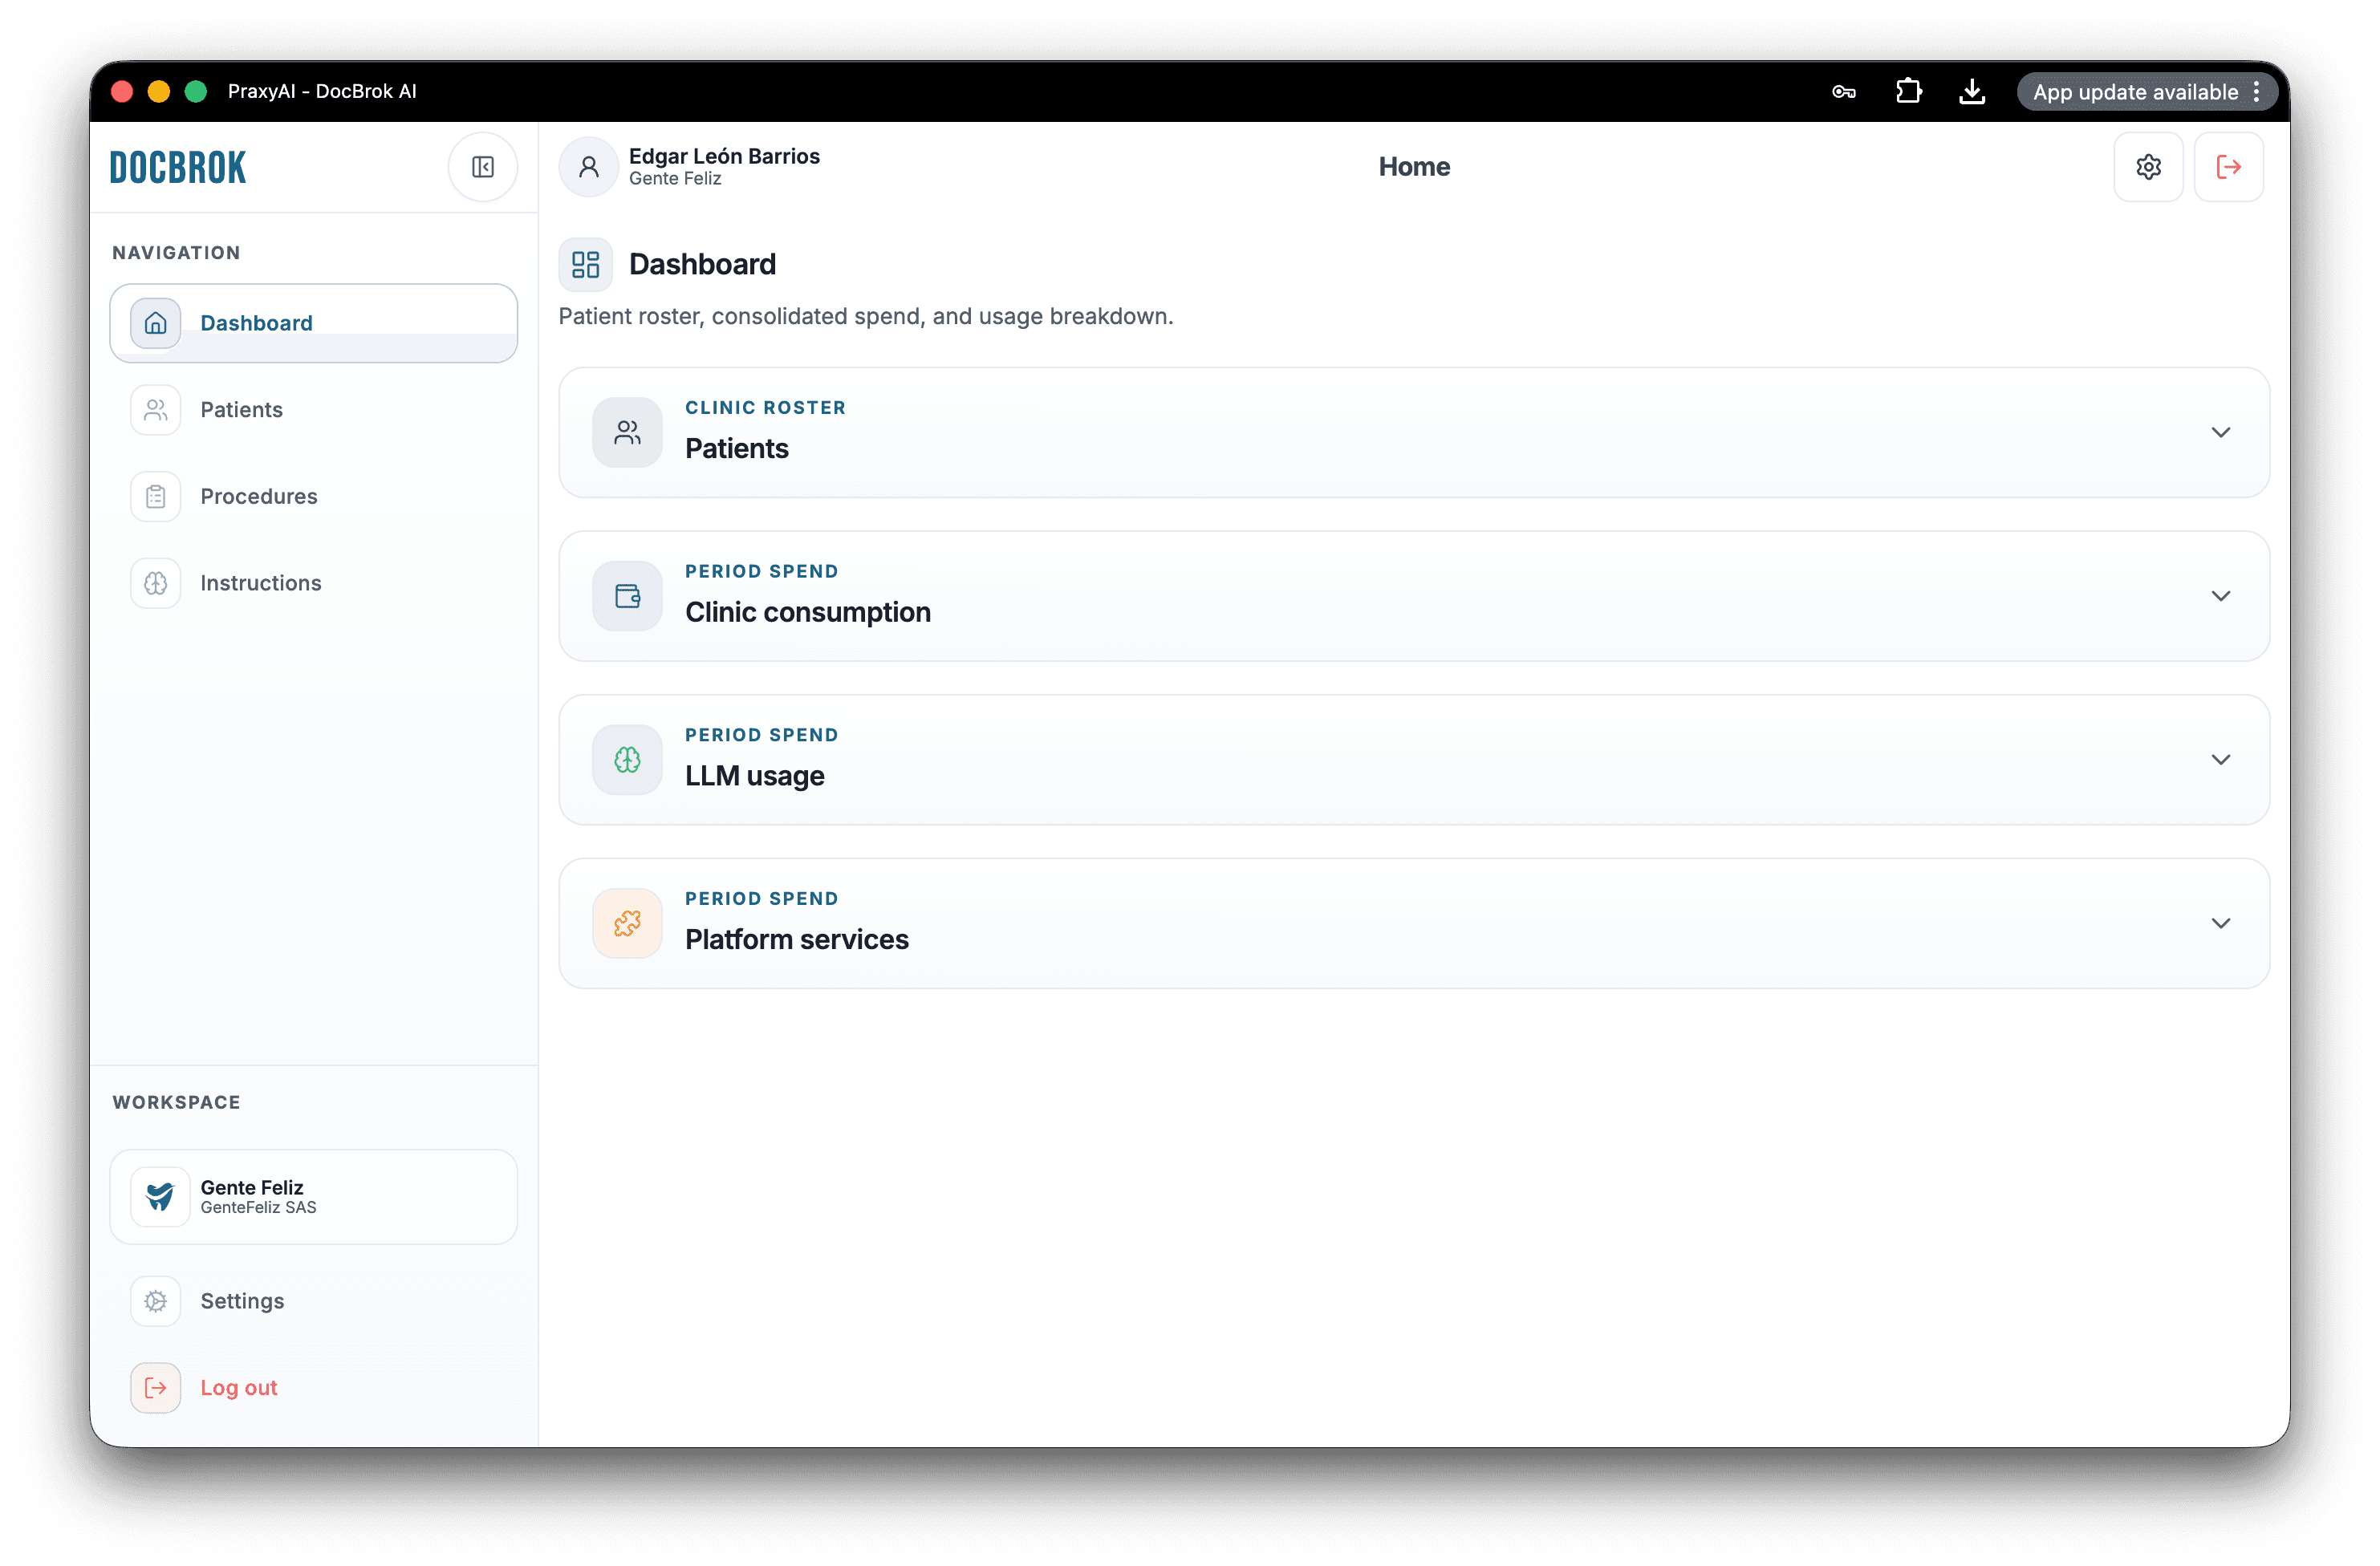
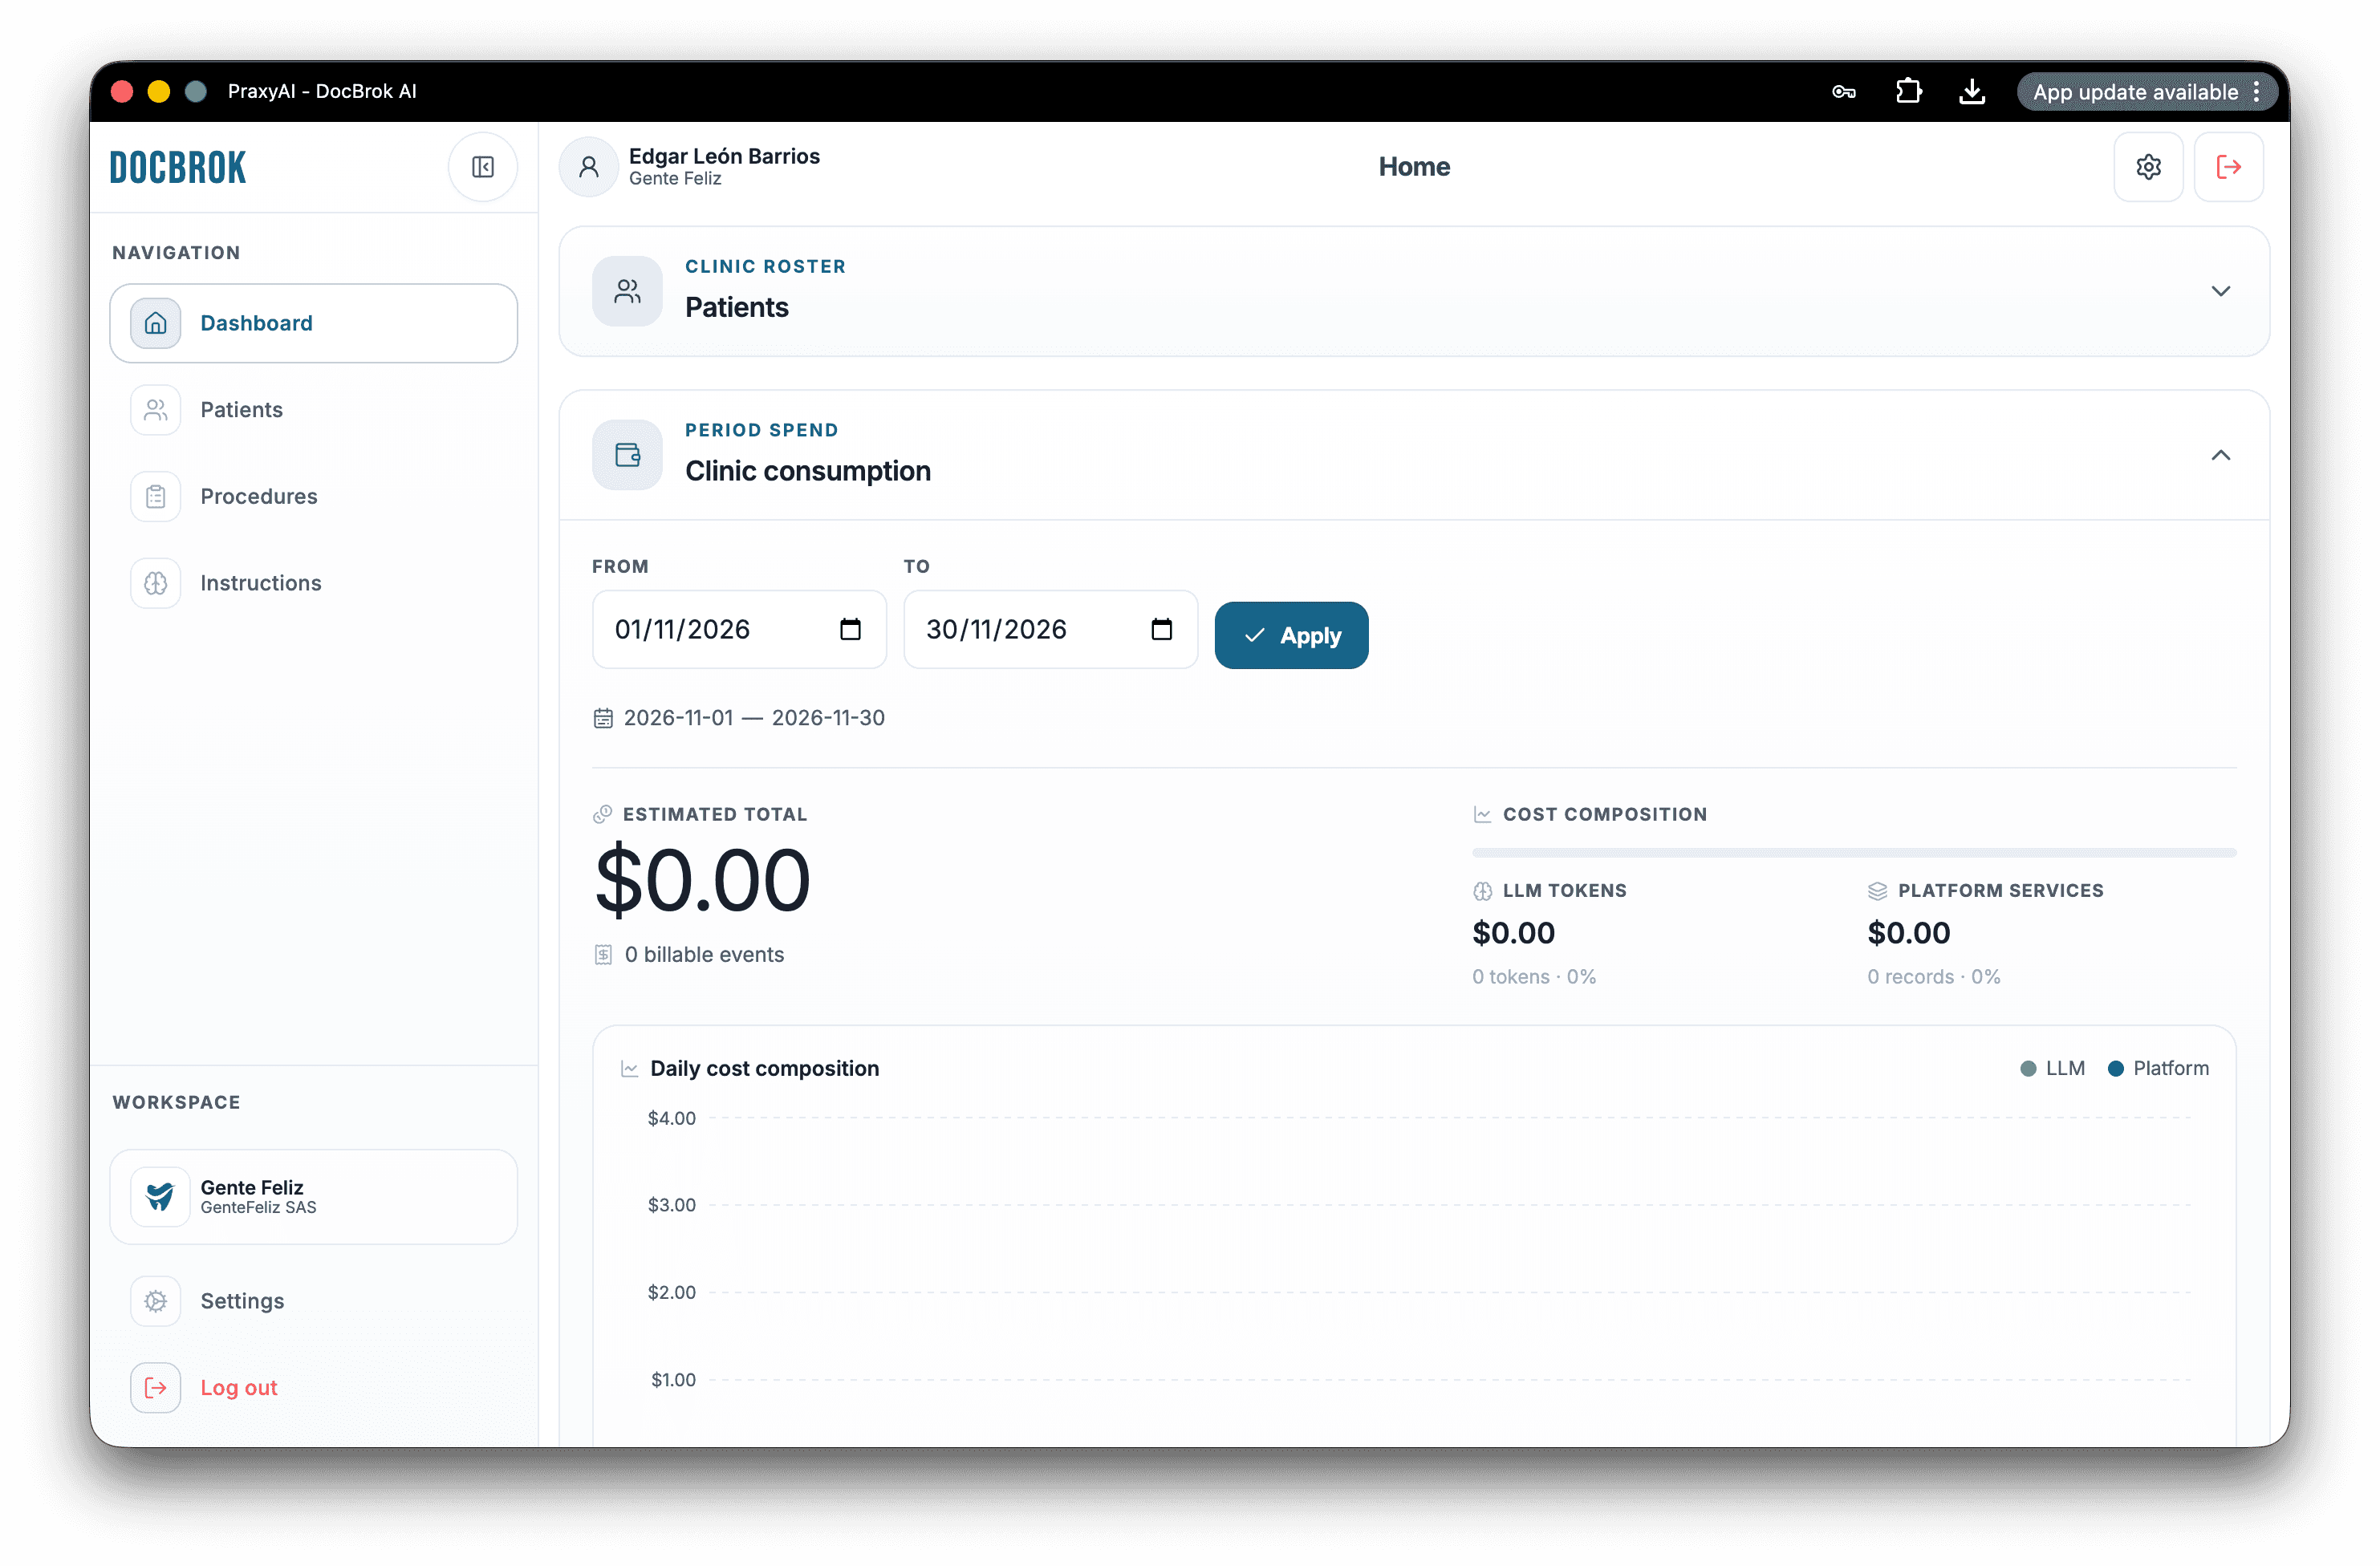
Total cost in USD
With a date range, the clinic sees the period’s total cost in dollars — DocBrok’s bill stops being a guess.
LLM tokens
How much comes from LLM tokens: vision, quotes, and simulations. Model spend is read by kind of work, not as an opaque block.
External vendors
How much comes from vendors: Face++, voice, video, storage, and FX. Every external API sits on the same board as AI usage.
Day-by-day evolution
Daily composition shows usage spikes. The clinic sees when spend rises and ties it to real operation.
Patient metrics
Total patients, leads versus non-leads, and gender: the commercial funnel is read beside cost, not in another tool.
Business value
Cost transparency, margin control, and confidence to scale AI use without fear of an opaque invoice.